PatientCare Analytics, Reports & Reviews

Various metrics, feedback responses & net promoter scores and google reviews available in the PatientCare platform.
Analytics
How various metrics are calculated.
- Click the navigation menu > Analytics Dashboard
Various metrics pertaining to your practice, and practitioners are available
Below is an explanation of the main analytical metrics
See statistical information in a Graph form - Response Rates: Response rate is calculated as the number of responses received from patients divided by the number of total messages sent
- Patient Loyalty: Using the scores collected from your patients, we can determine the NPS score
- Number of Google Reviews: If your practice is sending Google Review requests through PatientCare, we provide a metric in the dashboard which tracks the total number of new reviews generated for your practice each month

Note: this number represents the total amount of Google Reviews for your practice, regardless of if the review came directly from a PatientCare request
If you aren't currently sending Google Review requests to patients through PatientCare and you'd like to begin doing so, please contact patientcare@centaursoftware.com
Viewing Patients' Feedback Responses Analytics
It is useful to know what your patients are saying about your clinic. We make this easy with data exports, and a live dashboard.
If your practice is sending feedback surveys to your patients through PatientCare, there are 2 ways to easily see all the feedback responses generated through these surveys.
- Via Analytics > Patient feedback
- Via Analytics > Reports
Click the navigation menu > Analytics- Scroll down to Patient Feedback common themes
- Keep scrolling down to find a list of all patient feedback with the relevant details - Patient name, feedback score, practitioner, centre, the date of submission, and finally the associated feedback comment
- From here, you can also press the Export Comments button to generate an excel sheet with all of the responses
- In the Analytics tab, if you navigate to the Reports section:
- You are able to generate a report containing all of the feedback responses submitted by your patientsNote: you are only able to export up to 90 days worth of responses. Please keep this in mind when selecting the Date Range
What is Net Promoter Score (NPS)?
What is NPS?
Net Promoter Score (NPS) is a benchmarking tool for customer (or, in your case, patient) satisfaction. NPS scores are collected by having your patients answer a brief survey, which gives insights about customer loyalty by measuring their willingness to recommend your business to friend, family member, colleague, or acquaintance.
NPS differs from other satisfaction metrics in that it indicates a customer's general sentiment about a brand, as opposed to their opinion on specific interactions or purchases. NPS is used by companies worldwide, making it a great way to gauge performance against other brands in your industry.
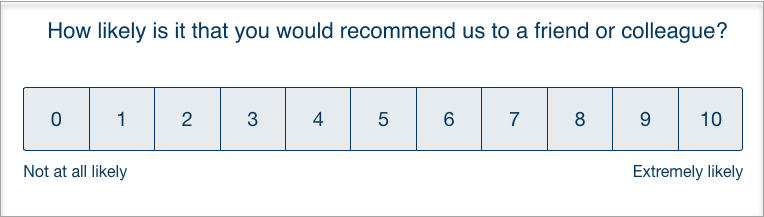
If you're set up with NPS and/or Online Reviews with PatientCare, your patients will receive a survey in the days following their appointment which includes the following question:
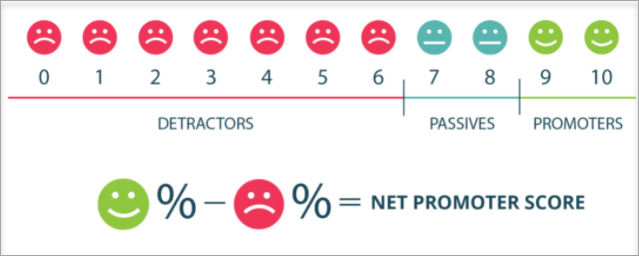
Using the scores collected from your patients, we can determine the NPS score. First, patient responses are split into 3 categories:
- Promoters: patients who respond with a score of 9 or 10. These patients are deemed more likely to exhibit behaviours that generate value to your business, such as returning more often and over a longer period of time, as well as referring more people.
- Passives: patients who respond with a score of 7 or 8. They are considered moderately satisfied, may remain loyal to the brand, but ultimately have the potential to change businesses if the conditions are right.
- Detractors: patients who respond with a score of 0 to 6. They are usually considered as actively dissatisfied customers, with the potential to damage your brand reputation though negative reviews, social media interactions, or word-of-mouth.
Then, to calculate the NPS score, we simply deduct the percentage of detractors from the percentage of promoters:
NPS scores can range from -100 to 100. Although the average NPS varies across different industries, a general rule of thumb is that a score above 30 is good, and anything above 70 is great (resulting in lots of positive word-of-mouth referrals).
Why is NPS important?
As previously mentioned, NPS helps businesses to measure customer loyalty - in other words, how likely they are to return, refer their friends and family, and resist pressure to switch to a competitor.
Even more important than any 1-month score is the trend of NPS over time. Using this methodology, and by referring to the Analytics Dashboard in PatientCare, you'll be able to track your NPS score over time, as well dive in to the patient responses to see why patients are promoters or detractors of your business.
In having this consistent feedback loop between your business and your patients, you're able to identify areas of concern from patients, and have a chance to change their negative impression. It also helps you channel customer service in the efforts to improve patient satisfaction, which can result in an increase of loyal patients, who are in turn far more likely to refer others to your practice
Google Reviews
Generate more Google Reviews
PatientCare can help you collect and generate valuable feedback from your patients.
We will send automated, personalised text messages to your patients after an appointment, asking them to rate and review their experience.
The survey consists of two questions:
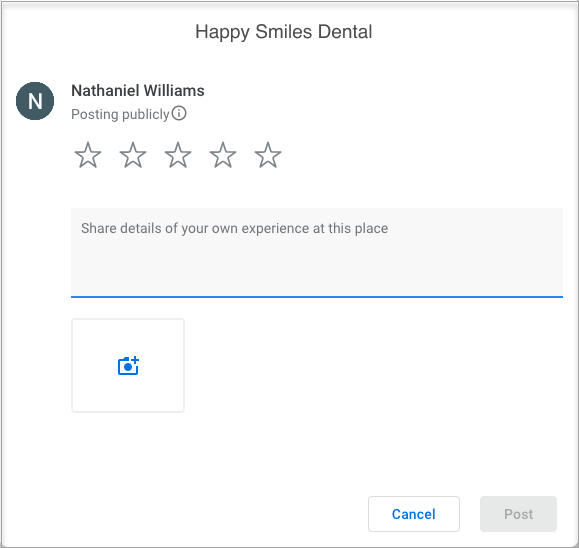
Then, after responding to the two questions above, they will land on an ending screen which will prompt them to leave a Google Review:

When the patient clicks on the Google Review button, they will be taken directly to your practice's Google Reviews page:
The number of Google Reviews your practice has received can be viewed in the Dashboard, on the Analytics page in PatientCare.
Record the Google Reviews Left
The practice can record whether a patient has previously left a Google review. This is a manual process, the customer must first verify on their Google account that the review has been posted, and then tick the corresponding checkbox.
At this stage, automation is not possible, as it is difficult to accurately match Google reviews to individual patients. This is due to patients often using a different name on Google than the one recorded in PatientCare.
Within the Patient Tab
- Search for the patient
- Tick Mark as Google Review left
Within the Alerts Tab
- Select Patient Profile
- This will take you directly to the patient's file
Related Articles
Clinical Reports in Dental4Web
A range of reports covering clinical matters such as Prescription, Treatment Plans, Treatment & Clinical Notes. Exporting, emailing and printing options available for all reports Links to 50+ other reports can be found at the bottom of this article ...Patient Reports in Dental4Web
A range of reports covering Patient file, referral, alerts, stats and communication. With exporting, emailing and printing options. Links to 50+ other reports can be found at the bottom of this article thread. Where to find the Reports page Click the ...PatientCare Setup & Manage
After Care check ins, chats & post-op instructions, allowing user experience feedback, comments, google reviews. User Experience Presentation See link below to the PowerPoint presentation summary of the user experience from Surgery to Patient. ...Inventory & Stock Control Reports in Dental4Web
A range of reports covering Inventory & Stock Control. With exporting, emailing and printing options. Links to 50+ other reports can be found at the bottom of this article thread. Where to find the Reports page Click the navigation menu > Management ...Health Fund & Insurance Reports in Dental4Web
A range of reports covering Health Fund information, H/F claims, Other Insurance and non H/F claiming reports. With exporting, emailing and printing options. Links to 50+ other reports can be found at the bottom of this article thread. Where to find ...