BIM Reports in Dental4Web

Business Intelligence Module is designed to enhance the analysis & statistic side of reporting. In addition to the numerous standard reports available in D4Web, there are 13 additional reports available here in the BIM.
Setup Procedure Classifications for BIM Reports
Procedures (items) can be grouped for reporting purposes. For example, to report on a group of items classified as New Patient Exam, instead of the individual items.
Reports impacted by Procedure Classifications:
- Fee Level Financial Analysis
- Insurance Funds Financial Analysis
- KPI-01 Report
- Procedures Done by Providers
The steps to setup are the same for each report.
- Click the navigation menu > Location Setup > Items page
- Record toolbar > Procedures Classifications
- Classification: Select the relevant report to setup groups for
- Groups section, click ADD
- Enter Group Name
- Enter Group Label
- In the Procedures section:
- Click ADD NEW
- Select items related to this group (Hold Ctrl key if more than 1 item is selected)
- Click OK
- Repeat to add more Groups to different reports, or click EXIT
Where to find the BIM Reports
Click the navigation menu > Management > Reports > Group: Business Intelligence Module
BIM Reports
Appointed Patient Statistics BIM Report
This report will display KPI counters of appointments within a selected time period including gender, age and appointment time
- Double click on Appointed Patient Statistics Report
- Date Range: Select the period to base this report on
- Consolidated report: Tick checkbox to show consolidated layout (example shown later in this article)
- Location: Select the location from the drop list if applicable
- Group Set/Book Name: Select the group(s) or book(s)s to base this report on
- Appointment Status: Select status(s) to base this report on
- Show inactive locations: Tick to show/include locations that have been made inactive (in multi-location environment)
- Show inactive books: Tick to show/include appointment books that have been made inactive
- Group Set/Book Name Radio Button: The group(s) or book(s) to include in the report
- Click OK
Report Details
- The report layout depends on whether the Consolidate Report checkbox is ticked.
- Consolidated displays a total amount of appointments containing at least one of the selected status(s) across all appointment books/groups and Locations selected.
- Non-Consolidated displays the number of appointments containing at least one of the selected status(s) per appointment book/group
- The report categorises the number of appointments using the below labels:
- Location: Name of selected location/s
- Book: Name of the appointment book/group
- Male/Female/Other: Total amount of appointments for male, female or other patients. Gender is selected in Patients > Gender drop list
- Adult/Child: Total number of appointments for adults and children.
- New Appt: Total number of new patient appointments in the selected period. The patient’s first seen date determines if it is a new appointment.
- Follow Up: Total number of existing patients’ appointments in the selected period. The date of the appointment being after the patient’s first seen date determines it is a follow up appointment.
- AM/PM: Total number of appointments before/after midday (12pm).
- Total: Total number of appointments for the selected reporting period.
Fee Level Financial Analysis Report
This report is for those who wish to report on the invoiced and discounted services associated with Fee Levels.
To report on groups of items, setup Procedure Classifications. Procedures Classification shows groups of item numbers, for example all items starting with 0 are within the “Items used 000” group.
You can create your own groups here as well.
- Double click on Fee Level Financial Analysis Report
- Date: Select the period to base this report on
- Location: Select the Location to base this report on, if applicable
- Show Summary Only: Tick to show totals only
- Include GST: Tick to show GST where applicable
- Group by Procedures: Tick to view the report by procedure classification; this is not available when showing summary only
- Fee Level: Select the levels to include in the report
- Procedures (items) Classification: Select the procedure classifications to include in the report
- Providers: Select the Provider(s) to include in the report
- Show inactive providers as well: Tick to include inactive Providers in the report
- Click OK
Report Details
Fee Level: Shows a list of the levels selected to be reported on.
Provider: Lists the provider’s selected to be reported on.
Original Total Invoiced this Period: Original Total means the item values before any discounts are made. The figures shown are for the selected period.
Discounted Total Invoiced this Period: Discounted total means the item values after any discounts are made. The figures shown are for the selected period.
Discounted Total Invoiced this Period: Discounted total means the item values after any discounts are made. The figures shown are for the selected period.
Disc % this Period: Calculates the % discount between the 2 values ‘Original Total Invoiced’ and ‘Discounted Total Invoiced’.
% of Total this Period: Calculates the % of the fees ($) compared to the overall total.
YTD Columns: The calculations are the same as previous columns, however based on the Year to Date.
Last YTD Columns: The calculations are the same as previous columns, however based on last Year to Date.
Huddle Checklist Report-01
The purpose of this report is to assist the dental clinic with daily planning of work/treatment.
This report contains 13 columns, some with specific information collected from within D4Web and some requiring manual input.
 Note: The report can also be accessed from: Click the navigation menu > Appointments. Right click in any appointment slot > Print > Huddle Checklist Report-01
Setup the Report
- Open the report from one of the above locations, but do not run the report
- Click Report Settings
- Within the "Report's parameters" window, specify the item number/s used for certain procedures, the recall set to use in the report and create 4 personalised columns. Column E - H are for manual input when printed
Run the Report
- Date Range: Select the period to base this report on
- Location: Select the location, if applicable
- Appointment Books: Select the Appointment Book(s) to base this report on
- Show inactive books: Tick to show/include appointment books that have been made inactive
- Click OK
Report Details
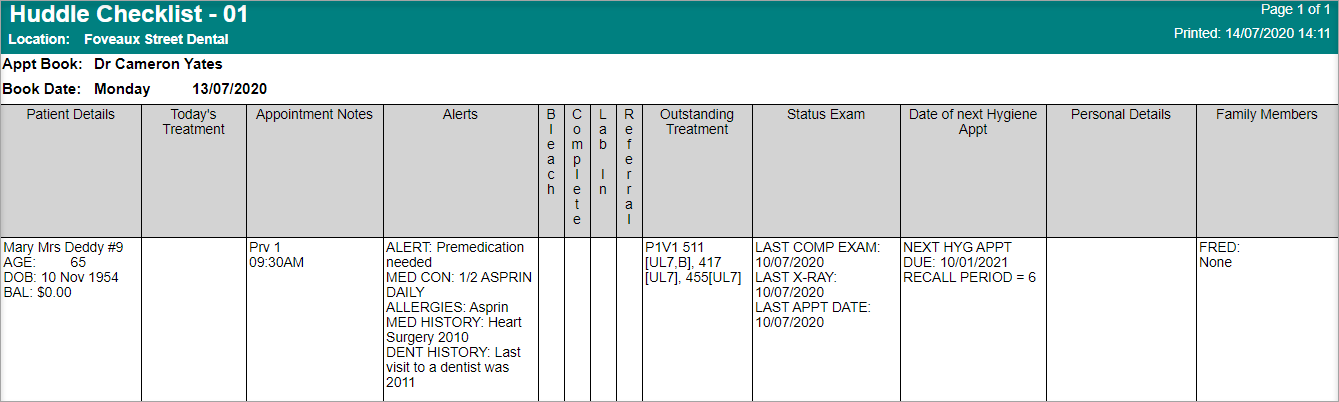
Patient details: The appointed patient’s name
(showing Preferred Name if it exists in place of First Name) and some other relevant details such as Card#, DOB, age and account balance.
Today’s Treatment: Treatment planned today for that patient – items linked from D4W Treatment Plan to that appointment.
(Item, tooth number and surfaces will be shown if entered in Treatment plan).
If no items linked, this field is empty.
Appointment Notes: Appointment provider code & start time of appointment are shown here.
If the appointment has additional information in the Notes field, it will show here.
Alerts: Patient’s active alert.
Also any content in Medical History, Dental History, Allergies Present and Medical Condition Present fields will be shown in this column.
Bleach/Complete/Lab In/Referral: These 4 columns are personalized in Report Settings.
User will tick here on the printout.
No data can be extracted from D4Web to fill in these columns automatically.
Outstanding Treatment: D4Web will look into the most recent active plan in the patient’s Treatment Plan page, and display any incomplete item/s (with tooth number and surfaces if relevant) here.
Also shown here are Phase (P) and Visit (V) of the items. If visit = ?, no visit number will be shown.
If the patient has another appointment in the future (a day greater than today), the appointment’s provider, date, day, time and linked treatment plan items will be shown under NEXT APPT section in this column.
Status Exam: Information shown in this column follows the Report Settings. Below explanations follow the Report Settings shown above in ‘Setup Report’.
LAST COMP EXAM: Last date item 011 was entered in Treatment page
LAST PERIODIC EXAM: Last date item 012 was entered in Treatment page
LAST X-RAY: Last date item 022 was entered in Treatment page
LAST APPT DATE: Last date any treatment item was entered in Treatment page
Date of next Hygiene Appt: Definition of a hygiene appt is based on the items setup in the Report Settings > Hygiene Items.
Below explanations follow the Report Settings shown above in ‘Setup Report’.
NEXT HYG APPT ACTUAL: The next appointment with any hygiene items linked from treatment plan. The appointment’s date, day, time and the linked item(s) will be shown in this section. If a hygiene appointment was booked without linking the hygiene items, no appointment will be shown.
NEXT HYG APPT DUE: The date shown here is the expected due date calculated by the system based on patient’s last hygiene date, plus the recall period in patient’s card for the recall type in Report Setting > Recall Set to use.
E.g. if the last date one of the hygiene items entered in the patient’s Treatment tab was 06/03/2019, the patient is on the Recall Reminder Set, and in this patient’s card the recall period of this recall type was 6 months, 06/09/2019 will be the NEXT HYG APPT DUE date; however, in Patient Details the Recall Date may be different.
If the patient is not on the recall type selected in Report Settings, nothing will be shown.
If the patient is not on the recall type selected in Report Settings, nothing will be shown.
RECALL PERIOD: The recall period in patient’s card for the recall type specified in Report Setting. If the patient is not on this recall type, no RECALL PERIOD will be shown
Personal Details: General information about this patient.
It is extracted from Patients tab > Insurance/Various sub-tab > Personal Details.
Family Members: If this patient is part of a family, the other members’ PREFERRED NAME(s) (if no PREFERRED NAME(s) then FIRSTNAME(s)) will be shown.
For each of these members, information for column ‘Date of next Hygiene Appt’ will be shown after their names if available.
If more than one family member, they will be sorted by age.
Insurance Funds Financial Analysis
This report is for those who wish to report on the invoiced and discounted services associated with Insurance Companies.
To report on groups of items, setup Procedure Classifications. Procedures Classification shows groups of item numbers, for example all items starting with 0 are within the “Items used 000” group. Users can create their own groups too.
- Double click to open Insurance Fund Financial Analysis Report
- Date: Select the period to base this report on
- Location: Select the Location to base this report on, if applicable
- Show Summary Only: Tick to show totals only
- Insurance Funds: Select the funds to include in the report
- Include GST: Tick to show GST where applicable
- Group by Procedures: Tick to view the report by procedure classification; this is not available when showing summary only
- Procedures (items) Classification: Select the procedure classifications to include in the report
- Providers: Select the Provider(s) to include in the report
- Show inactive providers as well: Tick to include inactive Providers in the report
- Click OK
Report Details
Insurance Fund: Shows a list of the insurance funds selected to be reported on.
Any non- Payment Solutions link accounts processed in the period will show in the <None> category
Provider: Lists the provider’s selected to be reported on
Original Total Invoiced this Period: Original Total means the item values before any discounts are made. The figures shown are for the selected period
Discounted Total Invoiced this Period: Discounted total means the item values after any discounts are made. The figures shown are for the selected period
Disc % this Period: Calculates the % discount between the 2 values ‘Original Total Invoiced’ and ‘Discounted Total Invoiced’
% of Total this Period: Calculates the % of the fees ($) compared to the overall total
YTD Columns: The calculations are the same as previous columns, however based on the Year to Date
Last YTD Columns: The calculations are the same as previous columns, however based on last Year. (Empty if you are a new D4Web user this year)
Items Performed by a Provider - BIM Report
This report is only available to users working in a Multiple Location Environment.
When a provider works at multiple locations, this is the report to be run for all items performed by the provider across all locations. Alternatively, you can run Items Performance report multiple times for each location the provider works at.
- Double click to open Items Performed by a Provider report
- Date: Select the period to base this report on
- Location: Select the location or Select All to include all locations
- Provider: Select Provider(s) or Select All to include in report
- Show Inactive Locations: Tick to include inactive location(s)
- Show inactive providers as well: Tick to include inactive Providers
- Orientation: Select Portrait or Landscape style to view/print the report
- Click OK
Report Details
The report shows the quantity of each item performed by the provider, separated by the location
KPI-01 Report
What features do i use for KPI-01 Report accuracy?
KPI-01 Report is a summary report for Key Performance Indicators and pools data from a variety of areas of D4Web and combines them into one report.
The report is for the whole practice (clinic-location) or by provider of a practice in that location.
The following features are required for the KPI-01 Report to calculate correctly.
Appointment Statuses:
For this report to calculate some KPI's, Failed to Attend, Unable to Attend and Arrived/Checked In/Out data must be recorded. Ensure each are setup
Setup Fail to Attend (FTA) - Setup Unable to Attend (UTA) - Link Marking Patient as Arrived to a Status
Setup Fail to Attend (FTA) - Setup Unable to Attend (UTA) - Link Marking Patient as Arrived to a Status
Arrived, Checked-in and Checked-Out:
For the report to calculate exactly how long each visit was, and when the appointments ran longer than planned time, this feature must be used
Mark an Appointment as Arrived, Checked In or Out
Mark an Appointment as Arrived, Checked In or Out
Link Providers and Books:
For the report to know which book belongs to which Provider, it must be set against the Providers file
Link Appointment Book to a Provider
Link Appointment Book to a Provider
Set Work Time:
When adding a Break or creating a new Preset Slot, the Work Time must be selected correctly, for example Staff Meeting = Yes, Leaving Early = No

If requiring instructions for the above features:
Non-Treatment and Reporting Items:
Not all item numbers are treatment and therefore should be setup so when they are used on a patient the report doesn’t think the patient has been seen on that day. For example, a new patient fails to attend and an the FTA item is added to their treatment. If the FTA item is not marked as non-treatment, the report will calculate them as a new patient
If requiring instructions for the above features:
Treatment within a Plan:
Some item numbers are seen as not requiring planning and can be excluded from the section of the report that identifies the quantity of treatment items performed without a treatment plan
e.g. when performing 013, this item isn’t planned therefore would unlikely to have been entered into a Treatment Plan.
- Operations menu > Set "Treatment without a plan" rules
- Ignore the following items: Enter the items to exclude from the report
- All Items: Tick to exclude all items from the report
- Combined Value: Enter the value of items to exclude from the report
- Click OK
Mark Bad Debts:
Bad Debts should be marked as such to ensure they are calculated correctly
Mark an Outstanding Balance as a Bad Debt
Mark an Outstanding Balance as a Bad Debt
Classify Item Numbers:
Items can be classified/grouped and be reported on as a group in the report
Setup Procedure Classifications for Reporting
Procedures Done by Providers Report
Setup Procedure Classifications for Reporting
Procedures Done by Providers Report
Report, Graph, Fee Level and Insurance Fund Settings:
The report can be viewed as both a report (figure) and graph, and the indicators to include can be preset.
- Open KPI-01 Report
- Report Settings: Select the indicators to view in report format
- Graph Settings: Select the indicators to view in graph format
- Fee Levels Set: Select the Fee Levels to include in the report
- Ins Fund Set: Select the Insurance Funds to include in the report
Set the Budget:
Setting a Budget is optional and only shown when selected in the report parameters.
- Open KPI-01 Report
- Report Type: Budget
- Click Set Budget
- Financial Year: Select the year to set the budget for
- Enter the target for each month
- Click OK
Run the Report
- Double click to open KPI-01 report
- Select settings: In the Report Parameters window, customise the report settings:
- Click REPORT SETTINGS to select which KPI measures will be included in the report
- Click GRAPH SETTINGS to select which KPI measures will be included in the graph
- Click FEE LEVELS SET to select which Fee levels will be included in the report
- Click INS FUND SET to select which Insurance funds will be included in the report
- Report Type
- Standard: Select to view the report without a budget
- Budget: Select to view the report with budget figures
- Report for
- Providers: The report options will include Providers; not available with budget type
- Location: The report options will be based on Locations
- Clinic: The report will be based on all Providers and Locations
- Breakdown
- Monthly: Figures will be based on a monthly basis for a financial year
- Daily: Figures will be based on a daily basis for a selected period
- None: Figures will be totalled for the selected period (this is the only selection that allows manual date range selection)
- Financial Year
- Current: The report will be based on the current financial year
- Previous: The report will be based on the previous financial year
- Custom: Select the financial year to base the report on
- Show Results as
- Report: The report will be shown as figures only
- Graph: The report will be show as a graph only
- Both: The report will show figures and graphs
- Location: Select the location if applicable; this is only shown if Providers or Location is selected above
- Providers: Select the Providers to base the report on; this is only shown if Providers is selected above
- Show inactive providers: Tick to include inactive Providers in the report
- For calculations, use the 'Schedule of Providers': Tick if Providers share one appointment book and Schedule of Providers is setup
- When you are ready to run the report, Click OK
Report Details
- Clinical Hours: Appointment book hours assigned as clinical work time
- Indicator based on: Open / empty times, Appointed times, Breaks and preset slots marked as work time (Yes), Patient checkout time (if later than day finish time)
- Example A: Start Time: 9am, Finish Time: 5pm > Appointments are scheduled in all hours, except 1hr for lunch (work time = no), Clinical Hours = 7hrs
- Example B: Start Time: 9am, Finish Time: 5pm > Appointments are scheduled in all hours, except 1hr for lunch (work time = no), the last patient checked out at 5.30pm, Clinical hours = 7.5hrs
- Gross Production: The total value ($$) of Items recorded in Treatment
- When an item number is entered in the Treatment tab with a fee it will be added to the gross production calculation.
- An invoice or payment does not have to be processed for it to be included in the gross production; unaccounted treatment items will be included also.
- This calculation relies on the amount recorded under the treatment tab in the fee field, no discounts or refunds will affect it.
- Net Production: The total value ($$) of invoices minus any refunds or discounts
- Example:
- Total value Invoices involving Provider 1 = $10000
- Total value of Discounts involving Provider 1 = $400
- Total Value of Refunds involving Provider 1 = $100
- Net Production for Provider 1= $9500
- Net Production per Clinic Hour: Net Production (KPI #3) / (divide by) Clinical Hours (KPI #1)
- Example:
- Net Prod Provider 1= $9500,
- Clinical hour’s Provider 1 = 200
- Net Prod / Clinical Hrs = $47.50
- Direct Costs (DC): Expense values as recorded in the treatment tab next to treatment items
- These expenses (e.g. Lab Expenses) have their own date values (payment date) separate from the items date.
- Double click in the Expenses field in the Treatment tab to access the History of Expenses box. The date under Payment Date is when this expense will be shown as a direct cost on the report.
- DC as a %: Direct costs (KPI #5) / Net Production (KPI #3) x 100
- Example: (DC 150/ Net Prod 9500) x 100 = 1.58%
- Net Prod - DC: Net Production (KPI #3) minus Direct costs (KPI #5)
- Example: Net Prod $9500 – DC $150 = $9350
- (Net Prod - DC) per Clinic Hour: (Net Production – Direct Costs (KPI #7) / (divide by) Clinical Hours (KPI #1)
- Example: $9350 / $200 = $46.75
- Patients Seen: The count of how many patients a provider has treated in that period
- Reliant on: Arrived with Attended Status, Checked In, Items added to Treatment
- Example: If the same patient is seen 3 times in a day (same day) at separate times, this is counted as 3.
- Consider it as number of appointments attended; it’s not a unique count. It doesn’t matter if it is new or existing patients.
- Patients Seen per Work Day: Patients Seen (KPI #9) / (divide by) Work Days
- Example: Provider 1, 128 patients seen, 18 work days that month: 128 /18 = 7.11
- Work days are calculated from the Appointment Book and are those not marked as a holiday that will be included. To ensure this calculation is correct setup appointment book templates so days not working are marked as a holiday.
- New Patients Seen: A count of new patients seen per month
- A patient is calculated as a new patient when at least one item number is entered to the Treatment tab for the first time.
- When the first item number is added to Treatment, this also automatically populates the first seen date in the Patients tab.
- New Patients Seen per Work Day: New Patients Seen (KPI #11) / (divide by) Work Days
- Work days are calculated based on what you have setup in the appointment book. To ensure this calculation is correct setup appointment book templates so days not working are marked as a holiday.
- Spare Appointment Hours %: The percentage of unused (Spare) clinical work hours
- A percentage is calculated based on unused/ un-booked time.
- Any breaks or preset slots marked as Work Time = No, will not be calculated.
- Use of the Checked In feature is required for appointments to be counted as used time.
- The white (unused) time in an appointment book should be due to inability to book a patient.
- Average Appt Treatment Time: The average length in minutes of each appointment
- The duration (in minutes) of each appointment can be determined from the Check In and Checkout times.
- The total of all durations are divided by the total number of appointments (attended) to get the average.
- Example:
- Appt 1 Check in time = 10:00AM, Checkout time = 11:00AM, appointment treat time = 60 min
- Appt 2 Check in time = 11:00AM, Checkout time = 11:30AM, appointment treat time = 30 min
- Appt 3 Check in time = 11:30AM, Checkout time = 12:30PM, appointment treat time = 60 min
- Average treat time = (60+30+60) / 3 = 50min.
- Average Appt Wait Time: The average length in minutes a patient was waiting to be seen
- The duration (in minutes) of each wait time can be determined from the difference of the Arrived and Checked In times.
- The total of all wait time is divided by the total number of appointments (attended) to calculate the average.
- Example:
- Appt 1 Appointed time 10AM, Arrived time = 10AM, Check in time = 10:05AM, Wait time = 5 min
- Appt 2 Appointed time 11AM, Arrived time = 10:50AM, Check in time = 11AM, Wait time = 0 min
- Appt 3 Appointed time 11:30AM, Arrived time = 11:35AM, Check in time = 11:45 AM, Wait time = 10
- Average treat time = (5+0+10) / 3 = 5min
- Appt Fail to Attend: The count of patients that have the Failed To Attend Status in their appointment
- All appointments for the month that have the Appointment Status: FTA
- If the same patient cancels within the same month the KPI- 01 will count as 1 cancellation.
- FTA per Work Day: The average number of FTA’s per work day
- Example: FTA count = 10, Work days = 20, FTA per work day is 10/20 = 0.5
- Appt Unable to Attend: The count of patients that have the unable to attend Status in their appointments.
- All appointments for the month that have the Appointment Status: UTA
- UTA per Work Day: The average number of UTA’s per work day
- Example: UTA count = 5, Work days = 20, UTA per work day is 5/20 = 0.25
- Treatment Plan Value: The total ($$) value in Treatment Plans created in this period (active Plans only)
- There are two areas of the Treatment Plan tab this refers to:
- The date of the Treatment Plan
- The Treatment Plan being Active
- Treatment Plan Value per Patient: The average treatment plan value per patient created in this period (month)
- The months Treatment Plan Value (KPI #20) / divided by the number of patients with Active Treatment Plans created in the same period. If the same patient has more than 1 plan in the same period (month), those plans are totaled then averaged for that patient.
- Example A:
- January 2019, 100 patients were seen, however only 11 patients had plans created, one plan was marked Inactive, the total value of Active plans was $10000, the average is 10000/10 = $1000.00
- Example 2:
- February 2019, 3 patients had plans created, one of these patients had 2 plans created, and all plans were Active.
- Pat 1: Plan A Value = $1000
- Pat 2: Plan B Value = $500
- Pat 3: Plan C Value = $2000
- Plan D Value = $750
- Treatment Plan Average value per patient = (1000+500+ ((2000+750) / 2)) / 3 = (1000+500+1375) / 3 = $2875
- Percentage Treatment Plans Completed: Percentage of treatment plans completed relative to the number that were created in that period
- Example:
- 100 new plans were created in this period and 60 plans were completed (completed from this period and/or old plans from past periods), then the % completed is 60%.
- It is possible that more plans can be completed than created for the same period, e.g. 110%
- Treatment Without a Plan: Work done (treatment) without the existence of a related treatment plan
- This is conditional on the following:
- The type of work (items) done, or
- Combined $$ value of work done on the one and same date
- Example: A patient has treatment done in the Treatment tab; these items are not linked to any plans. System determines whether to include them in the measure or exclude these.
- Pay on the Day %: Percentage of invoices paid in full on the same day as invoice was created
- When a patient is invoiced and pays 100% of the invoice on the same date as treatment.
- Also if there is a full payment for an old outstanding invoice on this day (period), then that is counted as well.
- This means that the “Pay on the day %” is possible to exceed 100%
- Example:
- Pat 1 on 1/02/23 an invoice is raised for $100, and is paid on 1/02/23 $100 (100% paid)
- Pat 2 on 1/02/23 an invoice is raised for $200 and is paid on 1/02/23 $150 (part paid)
- Pat 2 on 1/02/23 an invoice is raised for $300 and nothing is paid on 1/02/23, but is paid on 2/02/23 $300
- Pay on the day % = 33.33% (1 out of 3 invoices are 100% paid on the day)
- What Patients Owe: The value of all unpaid invoices (due or not) for that provider at the end of that month
- Bad debts are excluded.
- Percentage of Pat Reappointed: A percentage of appointments attended that made another appointment.
- Each unique patient will have checked out with (or without) another appointment scheduled.
- A patient is recognised as reappointed when there is a time and date specified in the same appointment book.
- If the secondary appointment (reappointed), is booked for the same provider the report calculates the percentage against that provider. If the secondary appointment is for a different provider the report calculates the percentage against location.
- Example: 200 unique patients in a month with appointments attended and 50 of them re-appoint in the same appointment book.
- 50 divided by 200 = 0.25 = 25%
- Active Patients: A count of unique active patients over the last 18 Months
- An Active Patient is any patient who has had treatment performed (item/s added to Treatment tab) in the last 18 months.
- Ensure non-treatment item numbers (e.g. FTA) marked as non-treatment so those patients are not calculated.
- Net Prod per Active Patient: Net Production (KPI #3) / divided by Active patients (KPI #27)
- Example: Provider 1, Net Production = $9500, Active Patients = 1000, then 9500/1000 = 9.5
- Attrition Rate: Percentage of unique patients seen in a one month period 18 months ago that don’t appear in the appointment book since that month
- Example: October 2022, Prv 1 patients seen: 344
- 212 patients from Feb 2022 were seen again
- April 2023, Prv 1 attrition rate: 344 – 212 = 132
- When the attrition rate is calculated in the KPI-01 report for an individual provider, we report on those persons individual attrition rate irrespective of the fact that a patient may have seen another provider.
- When the attrition rate is calculated for the whole clinic, we report on that clinics overall attrition rate and don’t consider the individual providers. (As if the whole clinic was operating as one provider).
- Items Usage by Group: The item usage section calculates the percentage of each group of items that were used in that period.
- The total % when added up of all the Item Usage groups must equate to 100%
- The final column in the report on the far right shows the AVERAGE for that group over that period
- This section describes (as a percentage) the financial involvement of those groups of items as a percentage of the whole. When items are considered, it is irrespective of whether they are a part of an invoice or not.
- The items are grouped in default categories but can be customised by the user.
- Fee Type Net Production by %: The Net Production in % figure from invoices of patients who are on the specified fee levels.
- Fee Type Net Production by Amount: The Net Production in $$ figure from invoices of patients who are on the specified fee levels.
- Fee Type Net Production by Count: The Net Production is a count (of patients) from invoices of patients who are on the specified fee level(s).
- Fund Type Net Production by %: The Net Production in % figure from invoices of patients who are on the specified Insurance Fund(s).
- I.e. total of Invoice = $ 100, health fund A paid $80 the report will show 80% for health fund A 80% and 20 % for <NONE>
- Fund Type Net Production by Amount: The Net Production in $$ figure from invoices of patients who are on the specified Insurance Fund(s).
- Fund Type Net Production by Count: The Net Production is a count (of patients) from invoices of patients who are on the specified Insurance Fund(s).
- Totals / Average Column: Depending on the measure, the system calculates a Total or Average.
- On the matter of averages, it is the average of the overall results, not just the average of each individual month.
- I.e. for patients seen per day, the YTD column should be the total patients seen divided by the number of days worked, NOT the average of each month’s result (the 2 approaches can give different results)
- Location YTD (Year to Date) Average: This column serves as a comparison of this provider’s average figure versus the average figures of the whole (all active providers) of that practice location.
Treatment Plan Analysis Report
The purpose of this report is to help analyse the items from the Treatment Plan page.
The report is used to summarise the number of New, Completed, and Incomplete Treatment Plans in a period.
Considerations
- Plan Type: New
- For a treatment plan to be counted as New, the date/time stamp must be within the period of the report
- Plan Type: Completed
- For a treatment plan to be counted as Completed, all items must be transferred to the Treatment tab. The Done date on the Treatment plan of the last transferred item number will be within the period of the report
- Plan Type: Incomplete
- For a treatment plan to be counted as Incomplete, item numbers must be outstanding on the Treatment tab. Incomplete plans are not date specific; the report will look for ANY incomplete plan
- Active/Inactive Plans
- It is important to use the Active Treatment Plan Status feature to ensure plans are correctly categorised for reporting
- Treatment Plan Status: Rejected (Inactive)
To learn more about treatment Plan Status:
Run the Report
- Double click to open Treatment Plan Analysis report
- Report Parameters:
- Date: Select the period to base this report on
- Location: Select the Location to base this report on, if applicable
- Plan Types
- New: Tick to view treatment plans created in this period
- Completed: Tick to view treatment plans completed in this period
- Incomplete: Tick to view incomplete treatment plans for ALL dates
- Plan Status
- Active: Tick to include active plans on the report
- Inactive: Tick to include plans marked as inactive
- Show Details: Tick to see patient details in place of totals
- Incomplete plans older than #...: Enter the number of months a plan should be considered inactive; at least one item must be completed from a plan for this to work
- Providers: Select the Provider(s) to include in the report
- Show inactive provider as well: Tick to include inactive Providers
- Click OK
- Report Details
The report will show details of the selected report parameters, including the number of plans per type and the financial value of them.
Totals Only View
Detailed View
Related Articles
Clinical Reports in Dental4Web
A range of reports covering clinical matters such as Prescription, Treatment Plans, Treatment & Clinical Notes. Exporting, emailing and printing options available for all reports Links to 50+ other reports can be found at the bottom of this article ...Financial, Statistical & Business Related Reports in Dental4Web
A range of reports covering financial, statistical & business, including totals, commissions, production, staff attendance & ADA DelDC survey upload. Exporting, emailing and printing options available for all reports Links to 50+ other reports can be ...Patient Reports in Dental4Web
A range of reports covering Patient file, referral, alerts, stats and communication. With exporting, emailing and printing options. Links to 50+ other reports can be found at the bottom of this article thread. Where to find the Reports page Click the ...Inventory & Stock Control Reports in Dental4Web
A range of reports covering Inventory & Stock Control. With exporting, emailing and printing options. Links to 50+ other reports can be found at the bottom of this article thread. Where to find the Reports page Click the navigation menu > Management ...Health Fund & Insurance Reports in Dental4Web
A range of reports covering Health Fund information, H/F claims, Other Insurance and non H/F claiming reports. With exporting, emailing and printing options. Links to 50+ other reports can be found at the bottom of this article thread. Where to find ...